SentinelOne EDR / XDR with Smarttech247

Peer Review

Gartner brand name text logo in white with registered trademark symbol.
5-star rating
4.8

Proven Trust

Dark blue circle with two overlapping checkmarks, one green and one light blue.
ISO 27001 text with a globe outline symbol on a black background.
2025 winner badge for Cyber Security Excellence Awards with gold and black design.

VisionX now gives SentinelOne customers a layer of intelligence the native console cannot provide. SentinelOne tells a SOC analyst what is happening right now. VisionX tells a security leader what it means over time, and whether the organisation is getting safer or more exposed.

Talk to us

SentinelOne Partner

Talk to Our Team

Have a direct conversation about your environment with a member of our team.
Already running SentinelOne?
You may not be getting full value from it. We manage detection engineering and SOC coverage 24/7.
Evaluating SentinelOne?
We handle deployment, configuration, and managed operation end to end.
MSP delivering to your customers?
We provide the expertise layer behind your offer.
Moving from a legacy technology?
We help with migration, onbaording and IR
YOUR SENTINELONE DATA, TURNED INTO ANSWERS

VisionX Adds the Trend, Score and Board Reporting to SentinelOne

SentinelOne tells your SOC what's happening right now. It doesn't tell your leadership team whether you're safer than you were last quarter. VisionX closes that gap, using the SentinelOne data you already have. Nothing extra to buy. Nothing extra to configure.

1. Threat Velocity & Acceleration

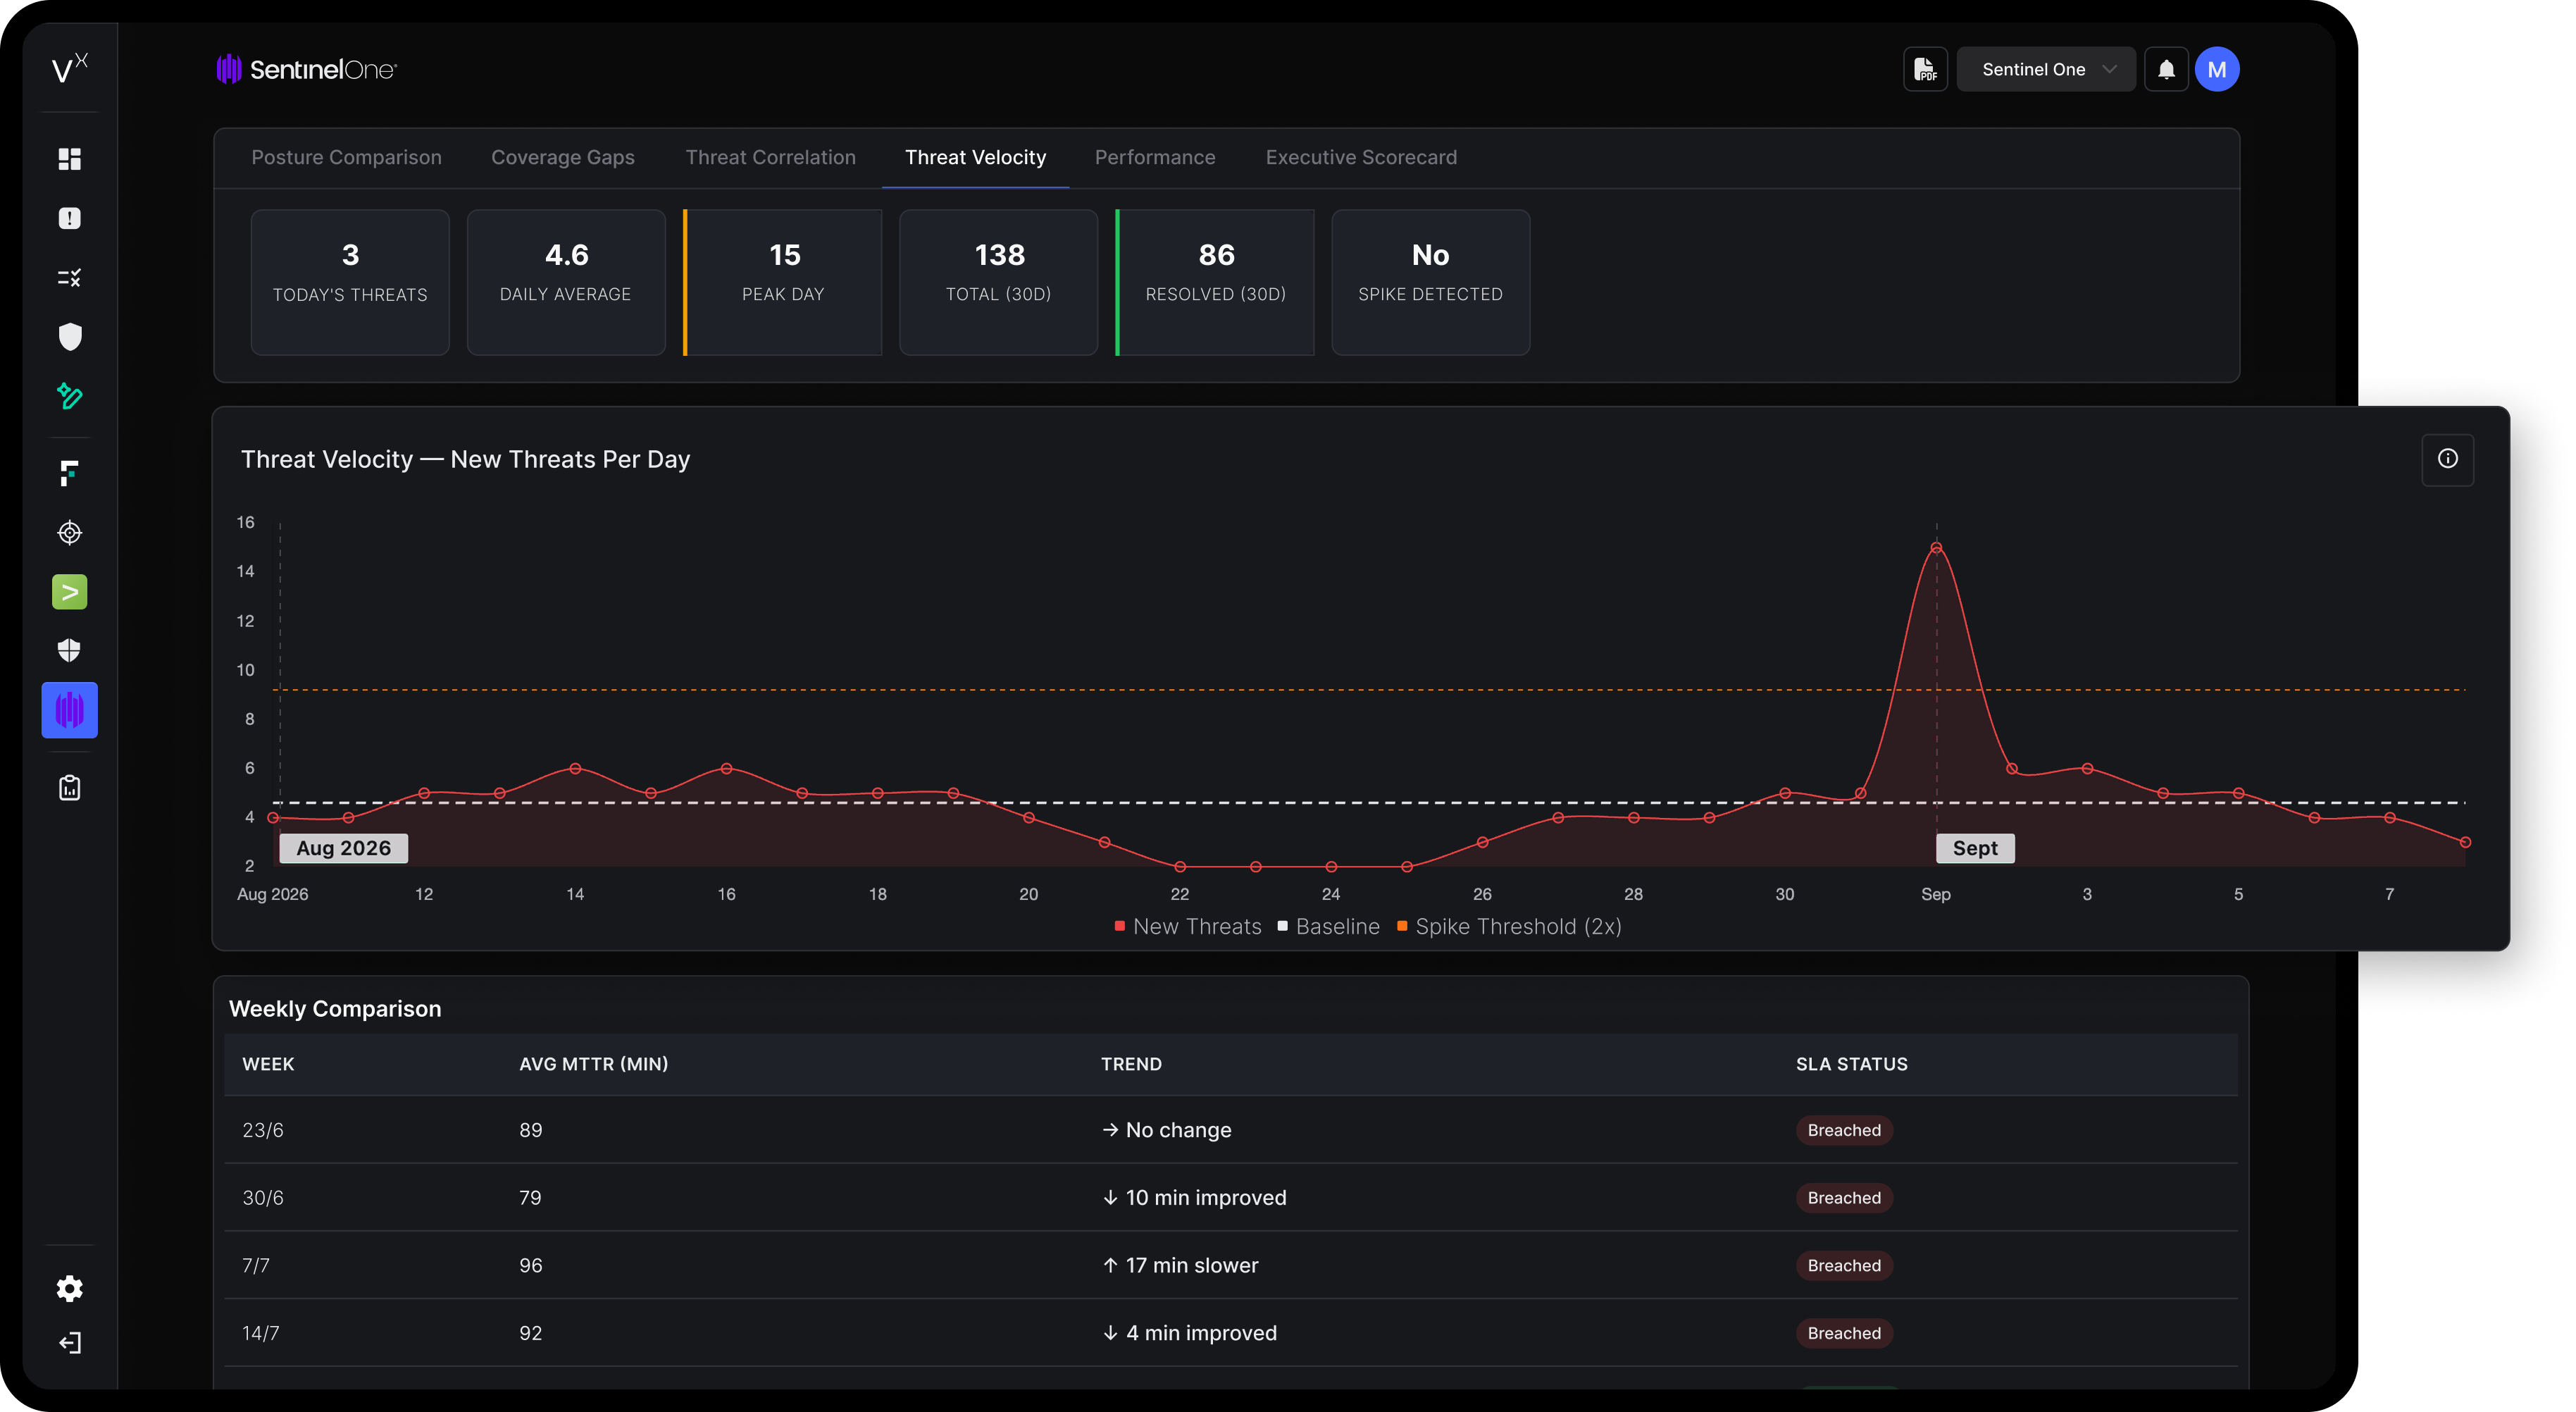
See threats speeding up before they become incidents. VisionX tracks daily threat volume against a rolling baseline and flags spikes automatically, so a quiet week that suddenly doubles gets caught immediately, not three weeks later in a report.

2. Cross-Time Posture Comparison

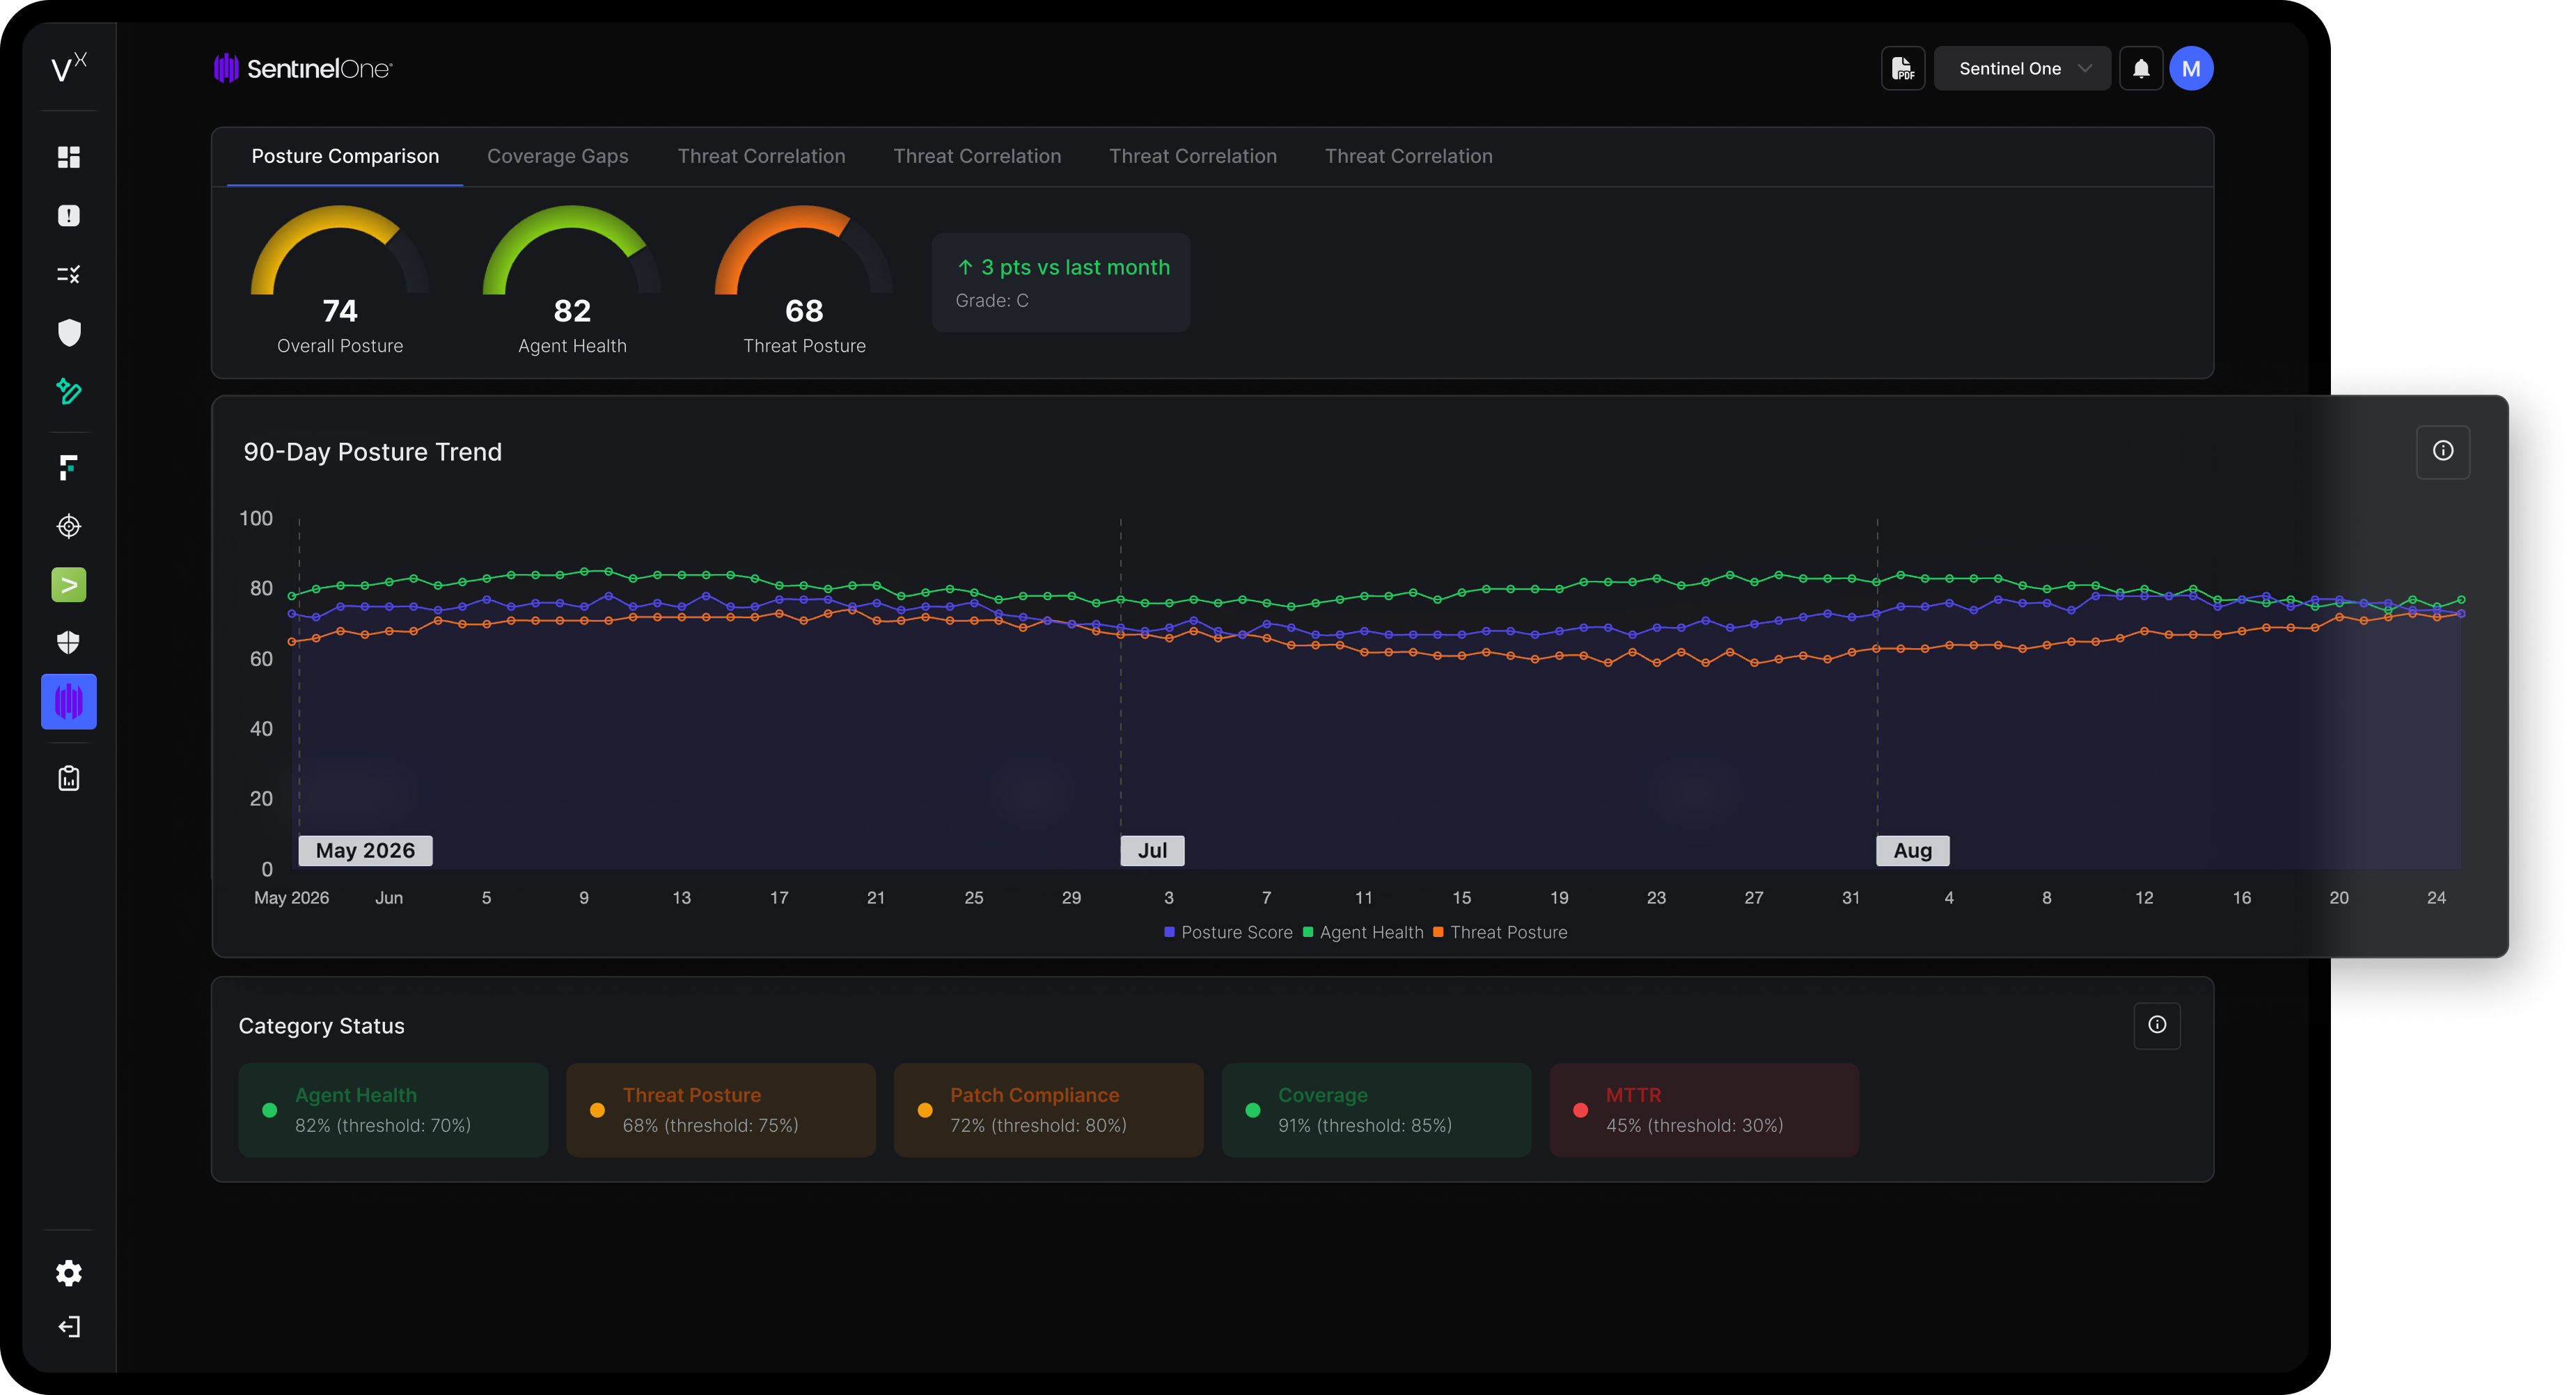
A single daily security score, tracked over 30, 60 and 90 days. This answers the question SentinelOne alone can't: are we actually getting safer, or just busier? Category breakdowns (agent health, threat posture, patch compliance) show exactly which part of the score moved and why.

3. Agent Health & Coverage Gaps

Stale, outdated or disconnected endpoints are exactly where attackers get in. VisionX surfaces agent staleness, version drift and fleet-wide health in one view, so gaps get closed before they're exploited, not after.

4. Threat-to-Agent Correlation

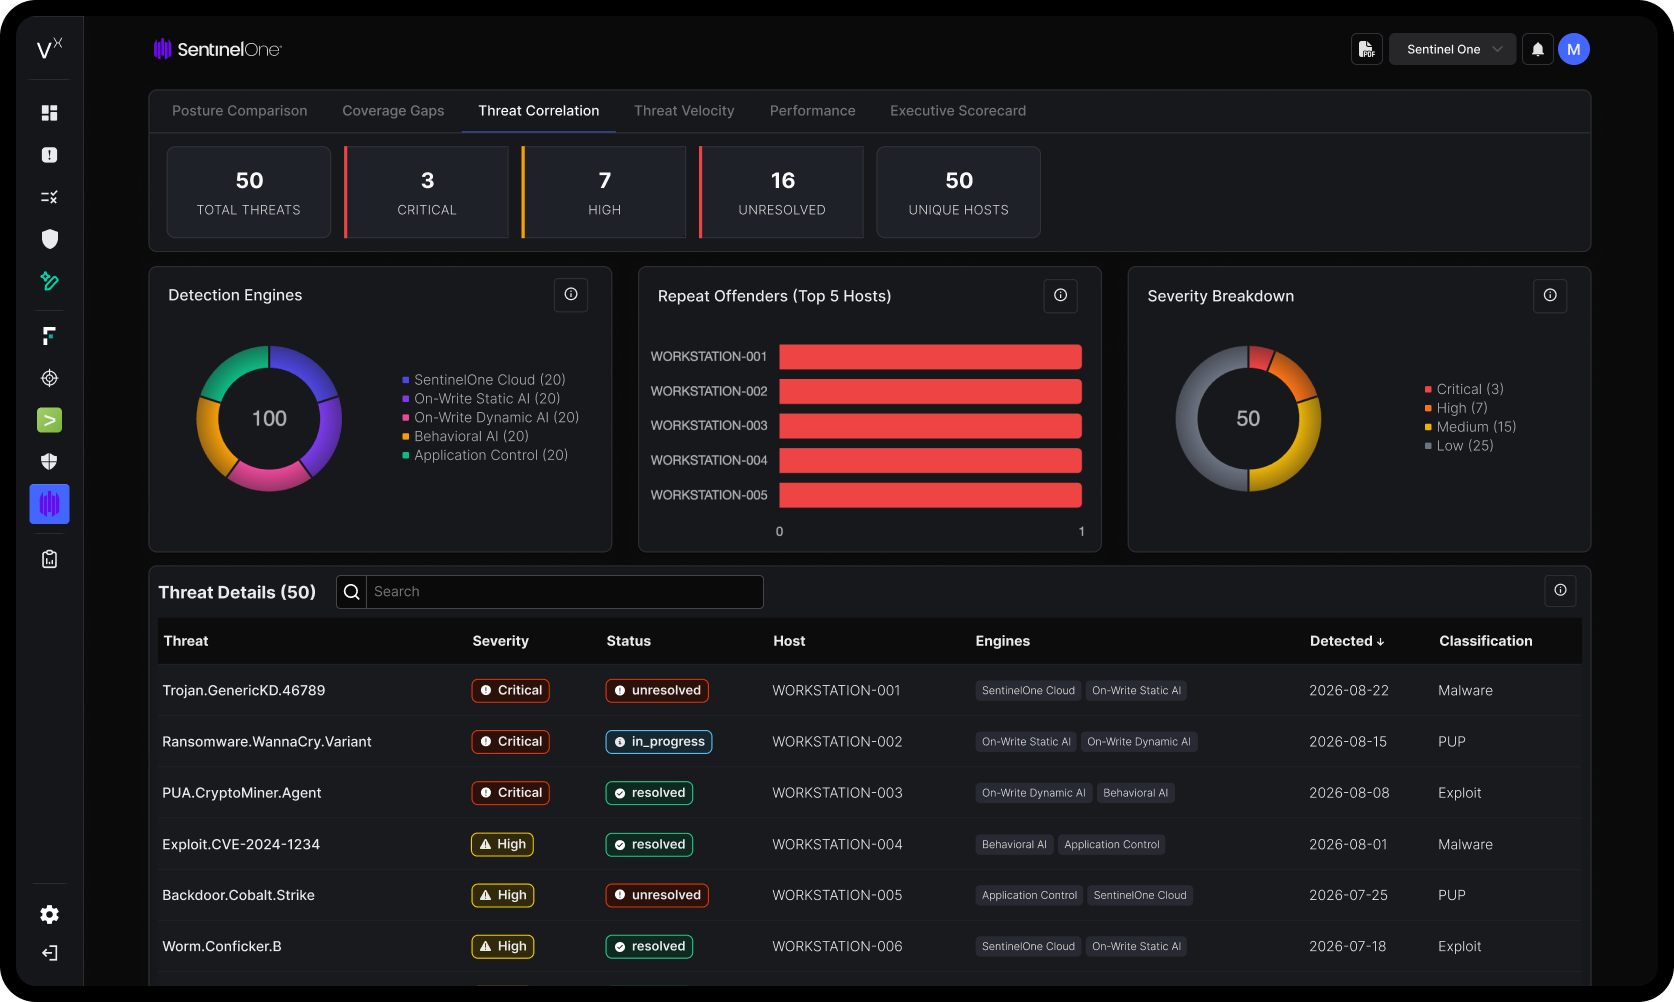
A small number of repeat-offender machines usually drive most of an organisation's risk. This view identifies exactly which hosts and endpoints are generating the bulk of threats, so remediation effort goes where it actually moves the needle, not spread evenly across the fleet.

5. MTTD/MTTR Tracking

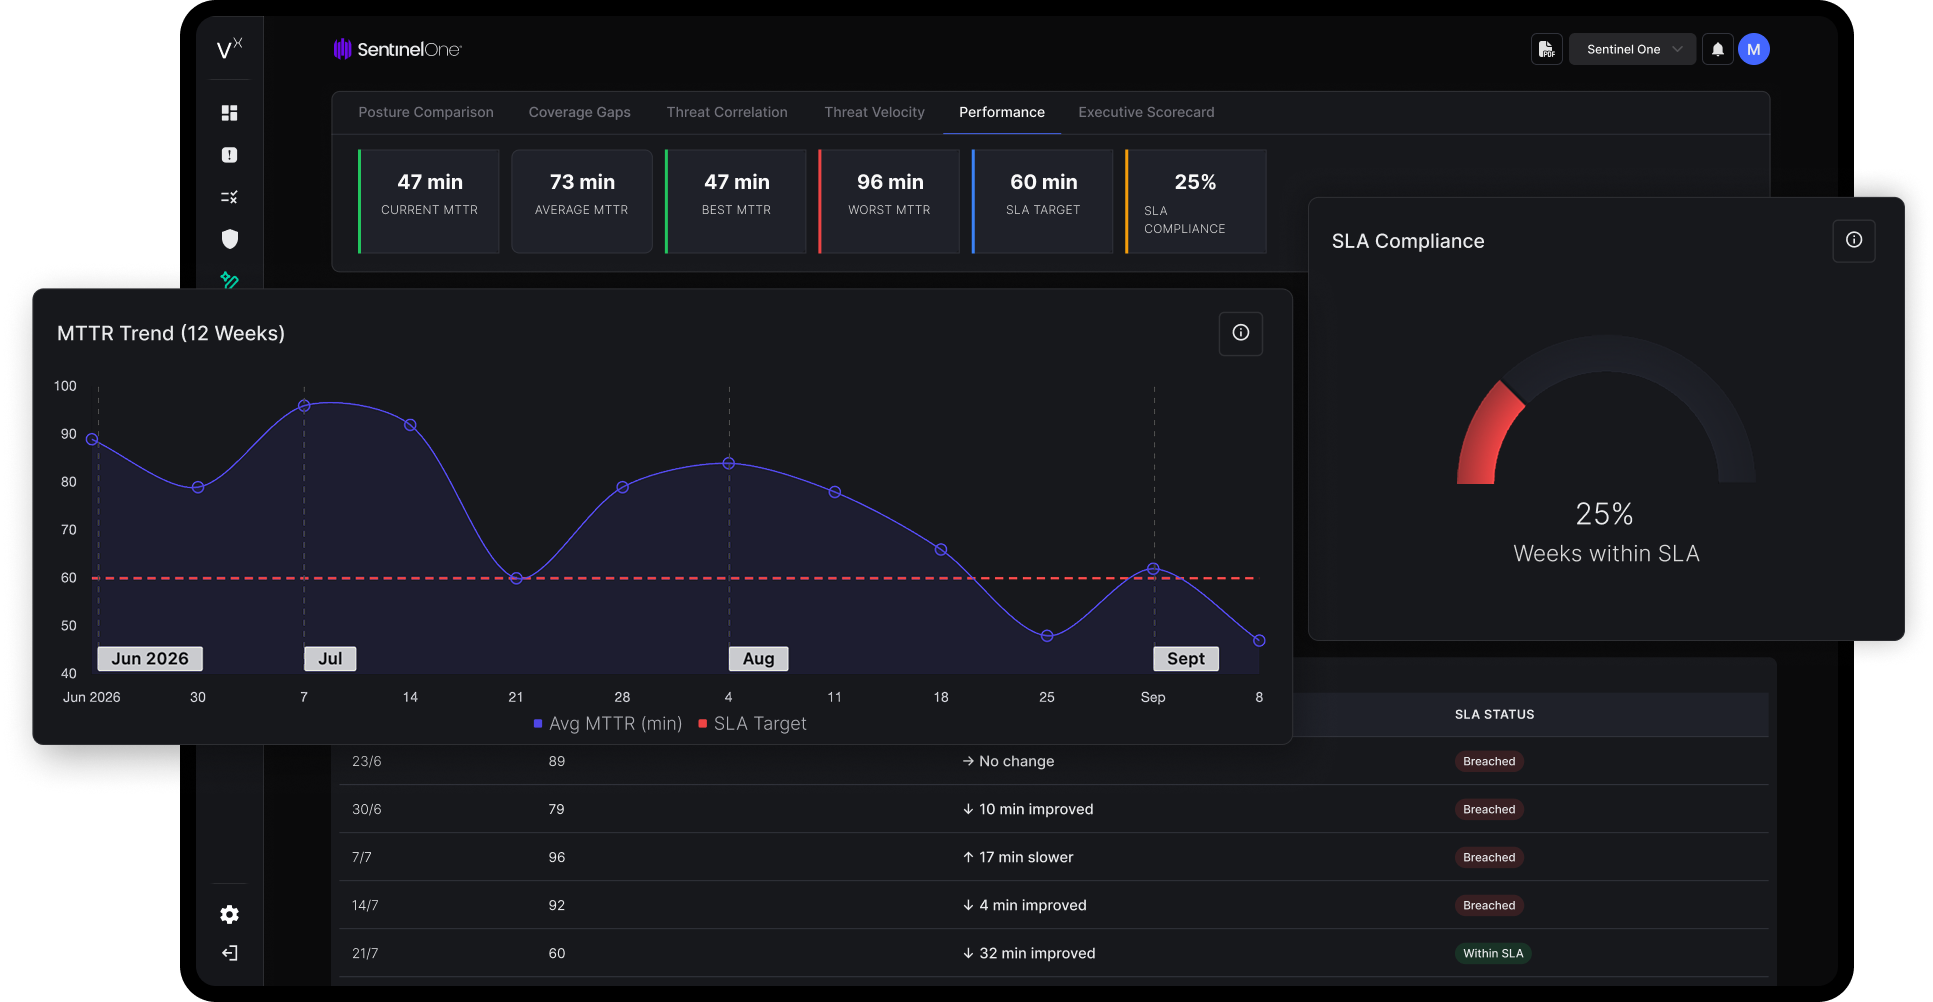
Prove your performance is improving, with data, not a status update. Mean time to detect and resolve for SentinelOne-sourced incidents is tracked and visualised, turning 'we've been busy' into a trend line leadership can actually see.

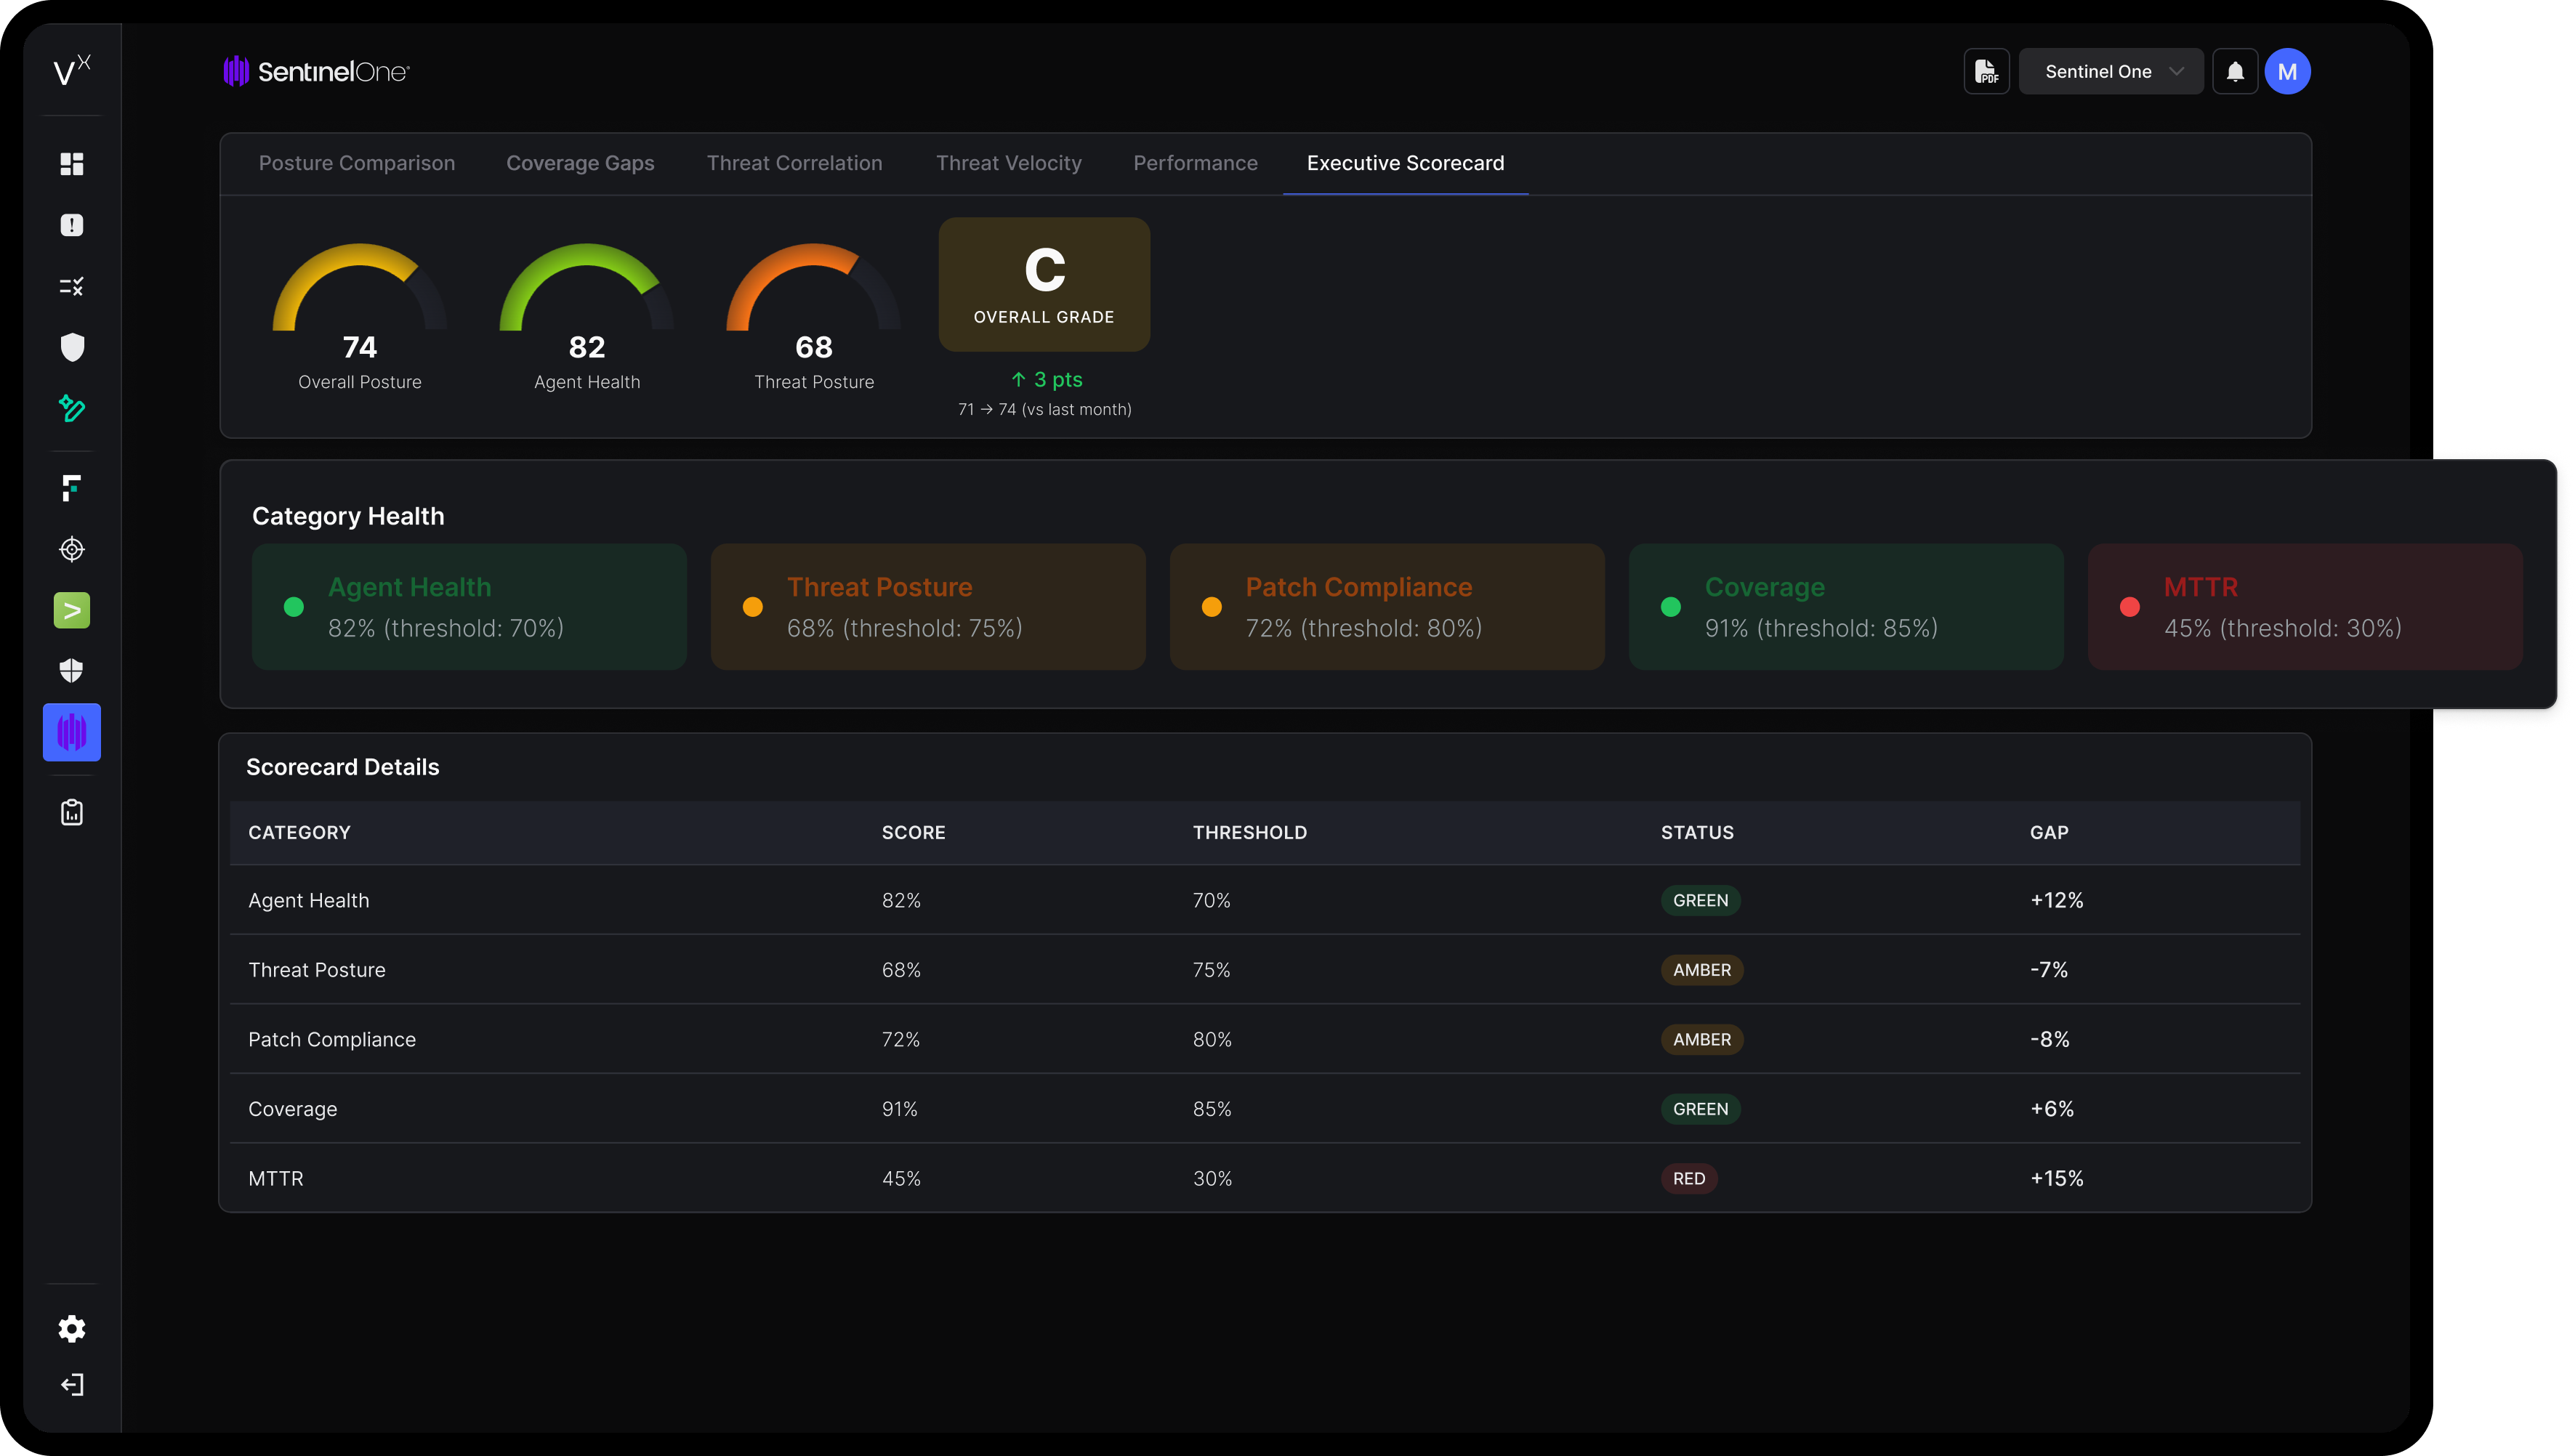
6. Executive Risk Scorecard

One 0-100 score, graded and colour-coded, exportable as a board-ready PDF. Built for the meeting after the SOC meeting: the one where leadership asks "how secure are we?" and needs a single confident answer, not a dashboard tour.

What VisionX shows

SentinelOne Native

Tableau / Power BI

VisionX

Historical trend analysis
Manual setup
Composite risk score
SLA compliance tracking
Risk concentration
Board-ready PDF export
Custom build
Setup required
N/A
Yes
None